Title here
Summary here
February 10, 2024 in Business Architecture, Business Strategy, Value Stream Mapping, continuous improvement6 minutes
Discover the best Value Stream Mapping template to optimize workflows and eliminate waste in your processes. Learn from real-life examples how to apply VSM in various industries, improving lead times and enhancing customer value.
Value stream mapping is a powerful Lean tool that can help organizations understand and improve their processes. A value stream map provides a visual depiction of all the steps required to deliver a product or service, from concept to delivery to the customer. It reveals waste, bottlenecks, and opportunities for streamlining workflows. While value stream mapping is flexible and can be customized to your specific needs, using a proven template ensures you capture the right information to make improvements.
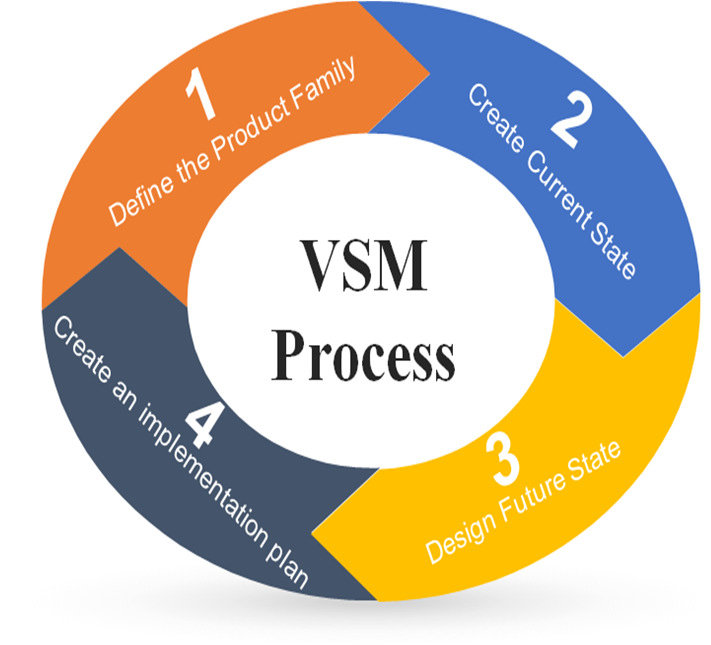
One of the most commonly used templates was developed by Rother and Shook in their book Learning to See. Their template divides the value stream into three main areas: the current state map, the future state map, and a plan to move from current to future state. The current state map shows the actual flow of processes as they currently exist, including all steps, lead times, bottlenecks, and types of waste. This provides a baseline for identifying areas for improvement. The future state map then depicts the ideal optimized flow, after non-value-adding activities have been removed. Finally, the gap analysis identifies specific actions needed to transition from current to future state.
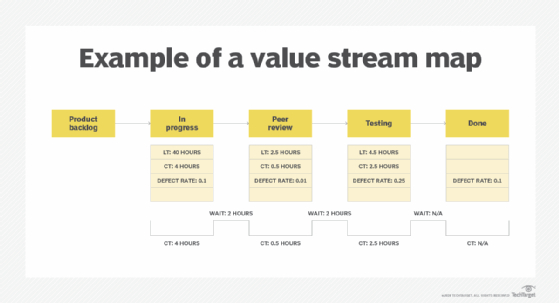
Within each map, there are standard elements to include:
Process steps: List out each individual step or activity required in the process, including both value-added and non-value-added work.
Lead time: Document the total time to complete each process step and the overall lead time from start to finish.
Inventory: Indicate where work-in-process inventory is stored between steps using boxes or cloud icons.
Information flows: Use arrows or lines to show the direction of information or material flows between steps.
Value-added vs. non-value-added: Differentiate value-adding from non-value-adding activities using standardized icons or markings.
Bottlenecks: Identify areas of constraint or above-average lead times using color coding or call-outs.
Waste: Note specific types of waste occurring such as defects, overprocessing, transportation, or waiting using waste icons or labels.
Cycle time: Record the average time required to complete a full cycle of the process.
This template provides a structured format to systematically capture details on process flows while keeping the maps clear and easy to understand. Additional elements can be customized as needed, such as including current capacity, future capacity targets, or responsibility assignments for each step.
Process steps:
Lead time:
Inventory: Cups, coffee beans, milk, and other ingredients are displayed behind the counter, indicating work-in-process inventory.
Information flows: Orders are communicated verbally and sometimes written down, indicating information flow from customer to barista.
Value-added vs. non-value-added: Preparing the drink is value-added. Waiting for the payment system to process can be considered non-value-added.
Bottlenecks: During peak hours, the drink preparation becomes a bottleneck due to high order volume.
Waste: Occasional drink remakes due to misunderstood orders, indicating defects.
Cycle time: The average time to serve a customer is about 9 minutes.
Process steps:
Lead time:
Inventory: Warehouse shelves are used to store inventory, with levels monitored by the inventory management system.
Information flows: Electronic flow of information from the online store to the warehouse system, and then to the shipping company.
Value-added vs. non-value-added: Picking and packing are value-added, but waiting for the next shipping batch is non-value-added.
Bottlenecks: Picking process can slow down if inventory is not properly organized or restocked.
Waste: Excess packaging material used for shipping might indicate waste.
Cycle time: The average time from order placement to shipping is approximately 40 minutes.
Process steps:
Lead time:
Inventory: The product backlog indicates work-in-process inventory.
Information flows: Requests flow from users to product team, then to the development team, and feedback flows back to the product team.
Value-added vs. non-value-added: Coding and testing are value-added; waiting for deployment scheduling is non-value-added.
Bottlenecks: Code review can become a bottleneck if there aren’t enough team members to review the increasing number of features.
Waste: Repeated bug fixes indicate defects, and long meetings might indicate overprocessing.
Cycle time: The average cycle time for delivering a new feature is 21 days.
These examples illustrate how value stream mapping can be applied to various industries, highlighting inefficiencies and opportunities for process improvement.
Some organizations further break down the value stream mapping template into swim lanes to distinguish between different functional departments or value streams. This helps analyze hand-offs and interactions between groups. It can also be useful to focus mapping efforts by first creating a high-level value stream map as an overview, then drilling down with more detailed maps for critical sub-processes or product families.
Regardless of the specific template, the key is to gather the right people involved in the process to participate in a mapping workshop. This ensures you accurately document the end-to-end flow and gain buy-in for future improvements. It works best if the team can visually plot out the current state map together on a large wall or whiteboard format to facilitate discussion. Photos or electronic files should then be used to preserve the maps for future reference.
Periodic value stream mapping helps maintain a Lean transformation by assessing whether changes have created new forms of waste. It keeps improvement efforts targeted toward eliminating the most impactful sources of muda. Establishing a regular cadence, such as mapping the top two or three value streams every quarter, ensures a continual focus on maximizing customer value. Adopting a proven template provides structure while allowing flexibility - enabling organizations to reap the full benefits of streamlining workflows through this powerful Lean technique.